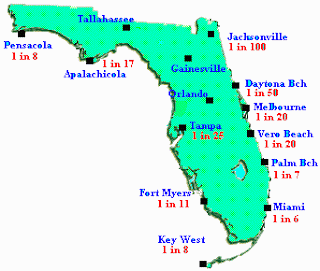
Statistical maps are used to map the quantity of a variable. they can be especially useful for displaying information such as rainfall or average temperatures. An example of a statistical map is a dot density map or choropleth map. This map displays odds for which a given city is likely to be hit by a hurricane.
Link:
http://noelgirl.blogspot.com/2010/12/statistical-map.html

No comments:
Post a Comment