Monday, November 21, 2011
Classed choropleth maps
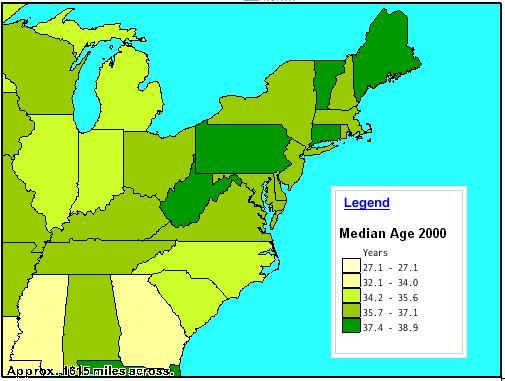
Classed choropleth maps generally include a frequency histogram which is used to interpret the data being displayed. Classed choropleth maps use shading and color variation along with statistical data to represent the information. The statistical data that has been compiled along with the histogram are used in order to determine the color variation and shading. Usually darker areas are used to represent larger data sets and lighter ones are used to represent smaller data sets. This map is showing the median age as of 2000.
 Link: http://hjp10.blogspot.com/2010/12/classed-choropleth-map.html
Subscribe to:
Post Comments (Atom)
No comments:
Post a Comment