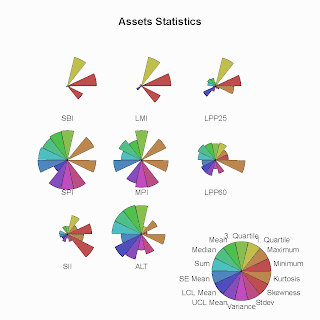
Star plots are an extremely useful way to display multiple observations observations with an arbitrary number of variables. Each observation is represented as a star-shaped figure with one ray for each variable. For each observation the length of each ray is made proportional to the size of its corresponding variable. With star plots variables are used to construct the plotted star figure. The data or star-shaped figures are usually arranged in a rectangular formation.
Link: https://www.rmetrics.org/node/35

No comments:
Post a Comment